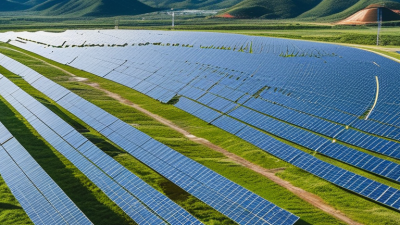
Solar energy has moved from a niche technology into a major global infrastructure market. IRENA’s Renewable Capacity Statistics 2025 reported approximately 452 GW of new solar capacity added worldwide in 2024. Solar represented most of the year’s renewable expansion. The figures are impressive, but they do not guarantee a successful project. A poorly planned solar system installation can still suffer from shading, undersized cables, weak mounting structures, or incompatible grid equipment.
This guide presents ten practical installation tips for global buyers. Each tip connects purchasing decisions with field conditions. Buyers should examine roof orientation, local sunlight, wind loads, snow risks, humidity, and available maintenance services. A coastal project may need stronger corrosion protection. A dusty commercial roof may require easier panel cleaning. In remote regions, spare inverters and clear warranty procedures can matter more than a small price reduction. The International Energy Agency’s Renewables 2024 report also emphasizes rapid solar deployment, while warning that grids, permitting, and integration must develop alongside generation capacity.
Experience suggests that the lowest quotation is rarely the complete cost. Freight, customs handling, testing, storage, installation labor, and future repairs can change the final budget. It happens often. Buyers should request documented performance data, recognized safety certifications, installer references, and realistic energy-yield estimates. No checklist can replace professional site assessment. Even experienced teams miss details when project assumptions remain unclear. These ten recommendations are designed to encourage careful questions, stronger supplier comparisons, and safer long-term decisions across different markets.
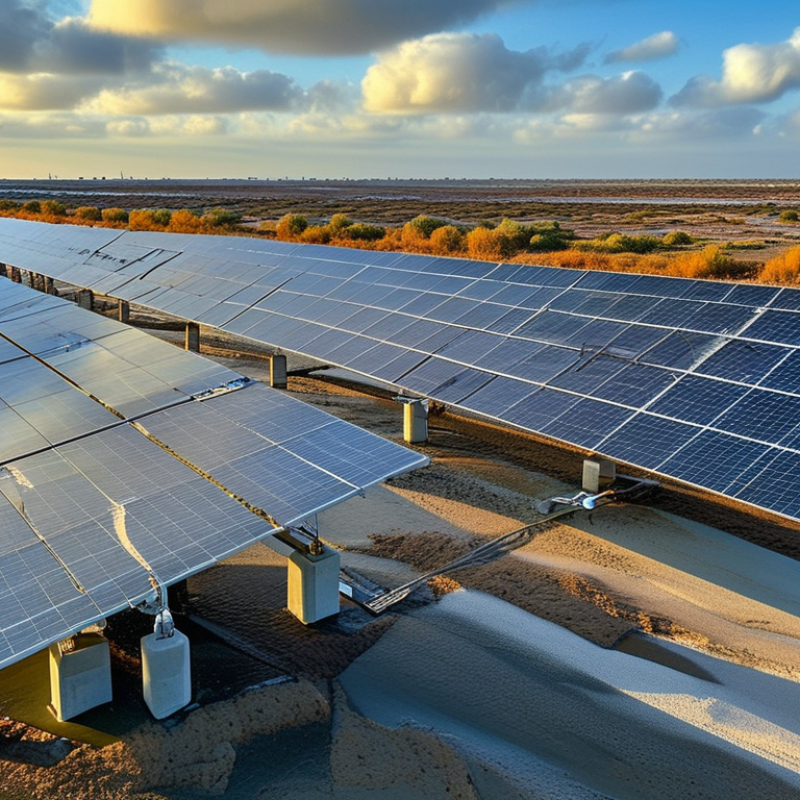
Solar potential must be measured locally, not guessed from annual sunshine. The World Bank’s Global Solar Atlas provides long-term irradiance maps, but a map cannot reveal a chimney’s afternoon shadow. Measure roof orientation, tilt, shading, and usable area during different seasons. A small obstruction can reduce output more than expected. PVGIS and local meteorological records can support the estimate.
Climate conditions also shape installation choices. The International Energy Agency reports that solar capacity expanded rapidly worldwide, while IRENA recorded about 346 GW of solar additions in 2023. More installations do not mean identical designs.
High temperatures reduce module efficiency, and coastal air can accelerate corrosion. Snow, dust, wind, and humidity require suitable mounting materials and maintenance access. Check local wind and snow-load standards before approving the structure.
Grid conditions deserve equal attention. Confirm voltage, phase type, export limits, outage frequency, and interconnection rules with the local utility. A system can produce excellent energy but still face export restrictions. Ask an accredited installer for a site survey, production model, structural calculation, and written assumptions. Review the details carefully. Estimates are not guarantees. Early assessments often overlook future trees, battery placement, or difficult cable routes. That is where the budget quietly changes.
10 Solar System Installation Tips for Global Buyers
Choosing the correct solar system starts with measured electricity use, not roof area alone. Review twelve months of utility bills and identify seasonal peaks. A small home may use more power during hot summers because cooling runs for long hours. Record major loads, including pumps, heaters, cooking equipment, and electric vehicles.
Peak demand matters. A system can produce enough daily energy but still struggle when several appliances start together. Check the inverter’s continuous output and short-term surge rating against these loads. Battery capacity should reflect evening consumption, backup expectations, and local sunlight patterns. Oversizing the battery may waste money, while undersizing causes frequent grid dependence.
Roof direction, shading, temperature, and snow also change production. Ask for a site assessment with hourly shade analysis, not a quick visual estimate. Component compatibility deserves equal attention. Confirm that panel voltage, inverter limits, battery chemistry, protection devices, and monitoring equipment work as one system. Local electrical rules may require specific disconnects, grounding methods, or fire access.
Leave room for expansion. Maybe.
A practical design should include documented calculations, product test certificates, warranty terms, and commissioning records. Independent inspection can reveal loose terminals, poor cable routing, or incorrect settings before these become expensive faults. I have found that simple assumptions often create the largest design errors. Recheck the load profile after installation, because real household behavior rarely matches the original spreadsheet.
Global solar buyers should compare equipment standards, certifications, and supplier reliability before comparing prices.
IEA PVPS Trends 2024 reported 456 GW of new photovoltaic capacity in 2023, showing how quickly the market is expanding. Fast growth also increases quality risks.
Check ten practical points.
Supplier reliability needs evidence.
IRENA’s Renewable Power Generation Costs in 2023 reported utility-scale solar costs falling to about USD 0.044 per kilowatt-hour. Lower costs are useful, but cheap equipment can create expensive replacements.
Ask for independent field-performance data from comparable climates. Speak with recent customers, not only provided references. I still treat every datasheet as a claim, not proof.
Site visits help, although they cannot reveal every production problem. A clear contract should define testing, delivery inspection, defect remedies, and documentation.
Real confidence comes from consistent records over several years. Not a polished presentation.
Planning a solar installation begins with the site, not the shopping cart. The IEA PVPS Trends in Photovoltaic Applications 2024 report recorded 456 GW of new solar capacity globally in 2023. That scale hides local differences. Check roof age, shading, drainage, wind exposure, and structural load before selecting equipment. Measure shadows at morning and afternoon. Keep cable routes short, protected, and accessible. Leave room for safe maintenance. A slightly smaller system may perform better than a crowded design.
Grid connection requires careful technical preparation. Confirm local voltage, frequency, phase arrangement, export limits, and approved protection settings. Anti-islanding protection is essential. Ask the utility for its application forms before installation. Include single-line diagrams, equipment certificates, grounding details, and commissioning records. IRENA’s Renewable Capacity Statistics 2024 reported global solar capacity of about 1,419 GW at the end of 2023. More systems mean stricter grid management. Delays often come from incomplete documents, not hardware. That is easy to underestimate.
Regional compliance also covers permits, fire access, labeling, meter replacement, and inspection rules. Some markets require certified installers or specific inverter functions. Others limit battery placement indoors. Translate every requirement into a project checklist, then confirm it with the utility and local authority. Photograph torque marks, cable glands, warning labels, and test readings. Keep the as-built file. My practical caution is simple: published guidance can be unclear, and installers can misread it. Recheck critical points instead of trusting assumptions.
Global buyers should price a solar system beyond its purchase invoice. Check local sunlight, roof orientation, shading, electricity tariffs, import duties, labor rates, and grid rules. Confirm the installer’s certifications and warranty terms. Ask for a site-specific production model, not a sales estimate.
Include ten practical checks: compare three quotations; verify annual energy yield; calculate battery replacement; price cleaning access; inspect drainage; reserve inverter replacement funds; review insurance; test monitoring equipment; confirm spare-parts availability; and model currency changes. NREL research commonly uses a 0.5% annual PV degradation rate. That small loss matters over twenty-five years. A 10,000-kilowatt-hour first-year yield may fall near 8,825 kilowatt-hours by year twenty-five. Real results vary.
Maintenance is usually modest, but neglect is expensive. Budget for inspections, connection tightening, vegetation control, and occasional cleaning. IRENA’s Renewable Power Generation Costs in 2023 reported a global weighted-average utility-scale solar LCOE of about $0.044 per kilowatt-hour. Household economics differ sharply because financing, taxes, climate, and retail tariffs change the result. Calculate payback, lifetime cost per kilowatt-hour, and discounted cash flow separately. A battery may improve resilience, yet replacement costs can weaken returns. My first spreadsheet would have ignored that. The more honest model includes cloudy seasons, downtime, and a conservative electricity-price assumption.
| No. | Installation Tip | Key Calculation or Target | Typical Reference Value | Long-Term Cost or Maintenance Impact | Energy Return Consideration | Practical Buyer Action |
|---|---|---|---|---|---|---|
| 1 | Match system size to annual electricity demand | System size (kW) ≈ annual electricity use (kWh) ÷ local annual solar yield (kWh/kW). | Annual solar yield commonly ranges from about 900 to 1,700 kWh per installed kW, depending on location, orientation, shading, and climate. | Oversizing can increase upfront cost and export losses; undersizing reduces bill savings. | Use at least 12 months of electricity bills and separate daytime from nighttime demand. | Request a production simulation using the exact site location and roof geometry. |
| 2 | Evaluate roof orientation, tilt, and shading | Compare annual output after applying orientation, tilt, temperature, wiring, and shading losses. | A well-oriented, unshaded array often performs close to the site's modeled solar potential; partial shading can cause disproportionate losses in affected strings. | Tree trimming, roof repairs, or relocating panels later can add labor and access costs. | A shading assessment is more reliable than using roof area alone. | Obtain a solar path or irradiance study for every roof plane used. |
| 3 | Include all lifecycle costs | Lifecycle cost = purchase and installation + permits + financing + maintenance + replacement − incentives and energy savings. | Operations and maintenance budgets are often estimated at roughly 1%–2% of initial system cost per year, with location-specific variation. | Include inspection, cleaning where needed, monitoring, insurance, component replacement, and disposal. | Compare lifetime cost per generated kWh rather than purchase price alone. | Ask for a 20- to 30-year cash-flow model with clearly stated assumptions. |
| 4 | Account for panel degradation | Year-n output = first-year output × (1 − annual degradation rate)n−1. | A planning range of approximately 0.3%–0.8% annual degradation is commonly used for modern crystalline-silicon modules. | Lower degradation improves long-term energy yield without increasing routine maintenance. | A 0.5% annual rate leaves about 88% of initial output after 25 years, before other system losses. | Use a conservative degradation assumption and verify the applicable performance warranty. |
| 5 | Plan for inverter replacement | Add at least one potential inverter replacement to the long-term financial model. | String and hybrid inverters are commonly planned over approximately 10–15 years; actual service life varies with heat, loading, installation, and maintenance. | Allow for equipment, labor, commissioning, and possible downtime. | A reliable monitoring system can identify abnormal production before losses become substantial. | Confirm replacement availability, service skills, warranty terms, and local spare-parts access. |
| 6 | Decide whether battery storage is justified | Battery size should reflect evening demand, outage requirements, tariff differences, and desired backup duration. | Battery round-trip efficiency is commonly about 85%–95%, depending on chemistry, operating conditions, and system design. | Include battery replacement, thermal management, capacity fade, and end-of-life handling. | Storage can increase self-consumption but does not create additional solar energy. | Compare battery savings under actual import, export, and time-of-use prices. |
| 7 | Use realistic self-consumption and export assumptions | Annual value = self-consumed energy × avoided electricity price + exported energy × export compensation. | Self-consumption varies widely with occupancy, load timing, battery use, and system size; it should be modeled rather than assumed. | Low export compensation can lengthen payback for oversized systems. | Shift flexible loads such as water heating, pumping, or charging into sunny hours where possible. | Check local rules for net billing, export limits, and changing tariff structures. |
| 8 | Prepare a climate-specific maintenance plan | Maintenance frequency should reflect dust, snow, salt air, humidity, wind, wildlife, and local access conditions. | Many systems require visual and electrical inspections at least annually; cleaning frequency depends strongly on soiling and rainfall. | Aggressive cleaning or unsuitable water can damage surfaces, seals, or frames. | A small amount of soiling may have a measurable effect in dry, dusty climates. | Specify safe cleaning methods, inspection intervals, and access responsibilities in the contract. |
| 9 | Verify electrical, structural, and grid requirements | Confirm roof load capacity, wind and snow loads, protection devices, grounding, voltage compatibility, and grid-interconnection limits. | Requirements differ by jurisdiction and grid operator; no single global specification applies. | Non-compliance can cause redesign, approval delays, additional equipment, or rejected connection. | Correct voltage and protection design reduces downtime and safety risks. | Use qualified local professionals and obtain approvals before ordering equipment. |
| 10 | Calculate payback, return on investment, and sensitivity | Simple payback = net upfront cost ÷ first-year net savings; also test discounted cash flow, internal rate of return, and net present value. | Results vary substantially with installed cost, electricity prices, financing, incentives, solar yield, degradation, and export rules. | A sensitivity analysis should test energy-price changes, lower production, higher maintenance, and replacement costs. | Use both energy yield per kW and financial return metrics to avoid overvaluing low-cost but low-output designs. | Request base, conservative, and optimistic scenarios before making the final investment decision. |
Planning note: Reference ranges are general engineering planning values, not guarantees. Actual performance and financial returns depend on local solar resource, site conditions, equipment design, regulations, financing, electricity tariffs, and maintenance practices.