How to Choose Residential Solar Systems in 2026?
Choosing residential solar systems in 2026 requires more than comparing panel prices. A suitable system must match your roof, electricity use, local climate, and future plans. The International Energy Agency’s Renewables 2024 report expects solar PV to deliver most new renewable capacity through 2030. That growth improves technology choices, but it also creates confusion. More options do not always mean better value.
The U.S. market shows why careful evaluation matters. The Solar Energy Industries Association and Wood Mackenzie reported approximately 6.8 gigawatts of residential solar installations in the United States during 2023. Battery storage is also becoming more important as households face time-of-use rates, outages, and changing grid policies. A family may need panels that produce strongly on a south-facing roof at noon. Another may need storage for evening cooking, medical equipment, or storm-related outages. Details decide.
Professional guidance should include more than a sales proposal. NREL research highlights the importance of site-specific production estimates, shading analysis, equipment performance, and long-term maintenance. EnergySage marketplace data also shows that installed prices vary by location, system size, financing, and battery selection. These figures provide useful benchmarks, not promises. No report can predict every roof. Installer quality, warranty support, permitting, and realistic payback assumptions deserve equal attention. A larger system may look impressive but waste money if the household exports excess electricity at a low credit rate. This guide examines how to compare residential solar systems in 2026 with practical evidence, transparent calculations, and room for honest uncertainty.
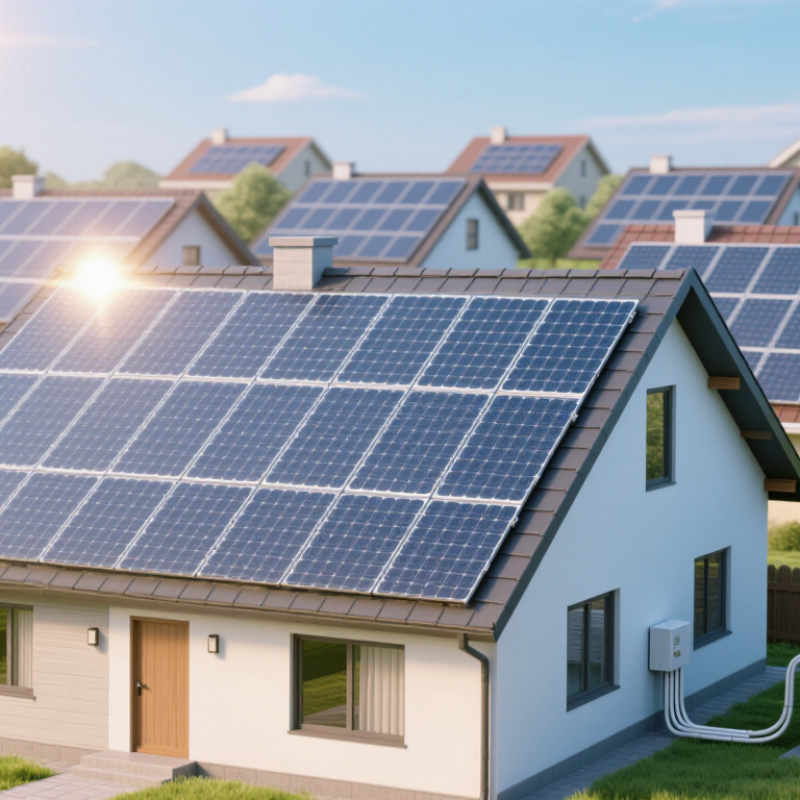
Assess Home Energy Demand and Solar Potential with NREL PVWatts Data
Choosing a residential solar system starts with two practical questions: how much electricity does your home use, and how much sunlight reaches the roof? Review 12 months of utility bills, noting seasonal peaks from heating, cooling, or an electric vehicle. Then use NREL’s PVWatts calculator to estimate production for your location. Enter the proposed system size, roof tilt, direction, and expected losses. Small changes matter. A south-facing roof and a west-facing roof may produce different amounts, even in the same neighborhood.
Treat the result as a planning estimate, not a guarantee. PVWatts uses weather and system assumptions; it cannot see the maple tree shading your roof at 4 p.m. Compare monthly estimates with your household’s seasonal demand, and test more than one system size or roof orientation. Check the roof’s age, vents, and nearby obstructions in person, too. A site visit can reveal details a calculator misses. It is tempting to trust a precise-looking annual number, but real production varies with weather, shade, and equipment performance. I would question any proposal that presents one estimate without explaining its assumptions.
Size PV Capacity Using Local Peak Sun Hours and Annual kWh Targets
How to Choose Residential Solar Systems in 2026?
Size PV Capacity Using Local Peak Sun Hours and Annual kWh Targets
Start with twelve months of electricity bills, not a guess based on roof size. Add the kWh used each month to find your annual target. Then check local peak sun hours, which estimate daily solar energy across the year. A useful starting formula is annual kWh ÷ (peak sun hours × 365 × system performance ratio). For a rough estimate, the performance ratio may be around 0.75–0.85, depending on equipment, wiring, temperature, and shading. For example, a 10,000 kWh target with four peak sun hours and a 0.8 ratio calls for about 8.6 kW of PV capacity.
Tips: Use a local, year-round sun-hours figure rather than a bright summer-day estimate. Check roof shade at different times. Small details matter.
Treat the calculation as a planning estimate, not a promise of exact output. A chimney shadow can affect a roof section, while winter sun may be much weaker than annual averages suggest. Compare the estimated yearly production with your actual kWh target, and consider whether your usage changes seasonally. If you plan to add an electric vehicle or heat pump, include that expected demand separately. A tidy formula feels reassuring, but it can miss real roof conditions. That’s worth checking before choosing a system size.
How to Choose Residential Solar Systems in 2026? - Size PV Capacity Using Local Peak Sun Hours and Annual kWh Targets
Illustrative residential sizing examples. Estimated DC capacity is calculated as annual electricity target ÷ (daily peak sun hours × 365 × 0.80 performance ratio).
| Representative Location |
Planning Peak Sun Hours
(hours/day) |
Annual Electricity Target
(kWh) |
Estimated PV Capacity
(kW DC) |
Approx. 400 W Modules |
Modeled Annual Output
(kWh) |
| Seattle, Washington |
3.5 |
6,000 |
5.87 |
15 |
6,132 |
| Chicago, Illinois |
4.0 |
9,000 |
7.71 |
20 |
9,344 |
| Denver, Colorado |
5.5 |
12,000 |
7.47 |
19 |
12,206 |
| Phoenix, Arizona |
6.5 |
12,000 |
6.32 |
16 |
12,147 |
| Miami, Florida |
5.5 |
9,000 |
5.60 |
15 |
9,636 |
| Boston, Massachusetts |
4.2 |
6,000 |
4.89 |
13 |
6,377 |
Peak sun hours are representative planning assumptions, not guaranteed site measurements. Actual production depends on the exact address, roof orientation and tilt, shading, weather, system losses, and equipment. The 0.80 performance ratio is an illustrative allowance; use a site-specific solar assessment and local solar-resource data before final system selection.
Compare 2026 Modules Above 20% Efficiency and Battery Performance
When choosing a residential solar system in 2026, start with modules above 20% efficiency. Higher efficiency matters when your roof has limited space. However, efficiency alone can mislead. Check the temperature coefficient, annual degradation rate, low-light performance, and tested output. A module producing well on a cool showroom roof may perform differently beside hot tiles. Ask for independent test data, not only marketing figures. Measure your roof’s shade during morning and afternoon hours.
Battery performance deserves equal attention. Compare usable capacity, round-trip efficiency, depth of discharge, cycle life, and operating temperature. A battery advertised at 10 kWh may provide less usable energy after reserve limits. For evening cooking, lighting, and electric-vehicle charging, estimate real household demand by the hour. Review the inverter’s power rating too. A large battery cannot help much if its inverter delivers limited output. Installation quality remains critical, and this is where some carefully planned systems still disappoint.
Tips: Request a battery warranty showing both years and retained capacity. Check whether emergency backup covers essential circuits or the entire home. Ask how the system performs during several cloudy days. Also, compare degradation assumptions over ten years, not just the first-year output. I would leave room for uncertainty. Household habits change, and perfect forecasts rarely exist. Choose documented performance, realistic sizing, and service support that remains available after installation.
How to Choose Residential Solar Systems in 2026?
Compare representative efficiency benchmarks for solar modules above 20% and residential battery technologies.
These are indicative technology-level benchmarks, not specifications for a particular product. Module efficiency and battery round-trip efficiency measure different processes, so use their separately scaled axes when comparing options. Actual performance varies by model, installation, and operating conditions.
Calculate Costs, Incentives, Payback, and LCOE with NREL Benchmarks
How to Choose Residential Solar Systems in 2026?
NREL benchmarks provide a useful starting point for residential solar decisions. They separate equipment, labor, permitting, financing, and soft costs. Use the latest NREL benchmark as a baseline, not a guaranteed quotation. Local prices can differ sharply.
Estimate annual production from roof size, shading, orientation, and local sunlight. Then compare the system price after confirmed incentives. Check current federal, state, and utility rules before counting any credit. Incentives can change. A simple payback estimate divides net cost by annual bill savings. However, electricity rates, maintenance, degradation, and financing can shift the result. I once made a payback estimate that looked excellent. I had underestimated winter shading.
LCOE offers a broader comparison. Divide lifetime system costs by total electricity produced, including replacement and financing assumptions. Compare this figure with your current utility rate, but keep the comparison fair. A low LCOE does not always mean the best roof design.
Tips: Request three detailed quotes. Ask for production assumptions, warranty terms, and permitting costs. Check whether battery replacement is included. Use conservative electricity-price growth. Keep a written record of every assumption. Recalculate after inspection. Small details matter.
Verify Grid Interconnection, Fire Safety, and IEEE 1547 Compliance
Choosing a residential solar system in 2026 requires more than comparing panel efficiency. Confirm grid interconnection before signing a contract. Lawrence Berkeley National Laboratory’s 2024 Queued Up report recorded about 2,600 GW of generation and storage capacity awaiting U.S. interconnection at the end of 2023. Residential projects are smaller, but utility reviews can still delay approval. Ask for written export limits, protection settings, meter requirements, and the expected inspection date.
IEEE 1547-2018 matters when an inverter connects to the grid. It defines functions for voltage and frequency response, abnormal conditions, anti-islanding, and communications. Request the inverter’s certification and utility approval, not a vague compliance statement. Fire safety also deserves a physical review. Check battery location, wall clearance, ventilation, emergency shutdown access, conduit protection, and warning labels. NFPA 855 provides widely used guidance for stationary energy storage, but local fire officials may apply additional rules. Installation quality is not always perfect. A tidy enclosure can still hide poor cable routing.
Tips: Photograph labels and disconnects during inspection. Keep the utility approval letter, single-line diagram, and battery test documents together. Ask the installer to explain one failure scenario, such as a nighttime outage. If the answer sounds rehearsed, pause. Confirm local requirements with the utility and fire authority before equipment arrives.